Creating safe contexts for sharing data
State agencies hold significant repositories of information, but at times they can be reluctant to grant access to this information. In addition to concerns about the legality and privacy of data sharing (see the sections on Legal Agreements and Data Security), the data that state agencies collect is complex and may be of uneven quality.
Unlike singular data points like the cost of a specific product or the location of a building, information in state longitudinal data systems is often based on complex formulas. For example, grade-point averages or annual earnings for a population of students require defining which individuals should be included in the calculation, and deciding how to combine multiple data points over time. These calculations may be handled differently by different agencies, and they may rely on different sources of information. For example, the definition of who qualifies as foster youth may be more comprehensive in some agencies than others, and some agencies may use an official register while others rely on self-reported data. State agencies may have concerns about erroneous interpretation by others who are less familiar with the nuances of how each data point is formulated.
Data collected by state agencies may also be of uneven quality. Measures associated with mandated reporting, such as graduation rates, are more likely to have clearly defined parameters and to have been scrutinized to ensure accuracy, both at the institutional and state level. However, data points that apply to only a subset of people, have many possible interpretations, or lack clear definitions–like participation in work-based learning–may have many missing or low quality responses. In addition, education, social service, juvenile justice, and workforce agencies rarely have significant budgets for technical systems or personnel. Critical measures may be collected and keyed in manually by individuals at schools and service sites who have little formal training on data definitions.
Therefore, it is vital that data providers have a clear understanding of the questions that are likely to drive requests for information and what the appropriate data points are to answer those questions.
Identify research questions first
Many states have created research agendas that identify and prioritize questions that are of high value to a variety of users of the longitudinal data system. California followed a similar process in designing the Cradle-to-Career system.
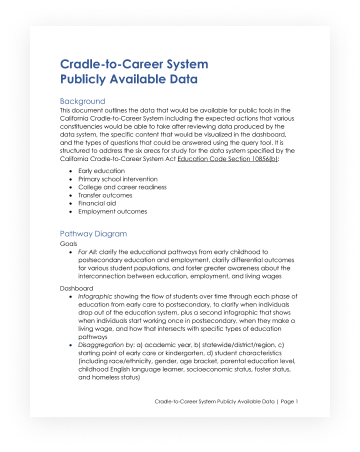
The legislation that authorized the data system identified six priority topics:
- Early learning: The long-term outcomes of early childhood services
- Elementary school: The long-term outcomes of primary school interventions
- College readiness: College readiness for high school students
- Community college: Timeframes for community college students to transfer to four-year colleges and earn a baccalaureate degree
- Financial aid: Impact of financial aid on educational and career outcomes
- Jobs: Employment outcomes after students exit education
Each of these topics was examined by the Research Agenda Subcommittee, which was made up of both state agency research staff and independent researchers with experience working with linked data sets. After reviewing the types of information other states had made available to answer similar questions, the group developed an expansive list of additional questions relevant to California. This list was then examined by members of the subcommittee, with additional input from the data providers, to determine what data points would be needed to answer those questions.
Next, the subcommittee identified ways that the six key topics could be represented in a format that would be useful to anticipated data users (see the Purpose and Vision section). This meant distinguishing between infographic-style dashboards that would be attractive to novice data users and more sophisticated tools that would allow users to create summary tables from the data points of their choice. These discussions revealed additional data points that would be needed to help to contextualize results, so that factors specific to institutions, such as resources and priorities, could also be examined rather than looking only at the outcomes of groups of people. In addition to expanding the list of data points, the subcommittee produced a set of specifications for the data points and sorting options that should be included in each dashboard. Finally, they identified the potential action items that each stakeholder group would be able to take based on the information provided, to clarify the value proposition for making that information available.
California’s priority research topics and data visualizations
You can review this information to determine whether similar questions are priorities for your state and consider how information can be displayed to make it more actionable.

Work collaboratively to define data points
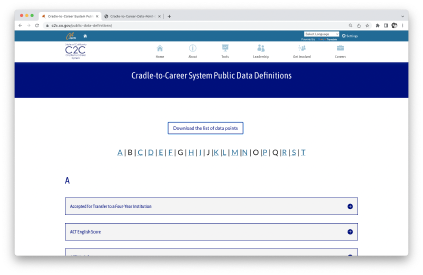
The planning team then convened a Data Definitions Subcommittee made up of data experts from each of the agencies that would provide information to the Cradle-to-Career system. Over the course of a year, the members of the Data Definitions Subcommittee documented whether they collected each of the recommended data points, provided documentation on how that data point was constructed by each agency, and evaluated the quality of each data point. They also reviewed the overlap between the characterization of each data point to determine how a concept could be represented consistently across data sources.
In some cases, the agencies were able to create consistent measures. For example, while different entities had expanded upon traditional race/ethnicity categories in different ways (particularly the category of “Asian”), all agencies could map their data back to seven consistent options. In other cases, it was determined that metrics had such different underlying definitions that they would need to be separate data points, which users could choose between when looking for information. For example, in K-12 “socio-economically disadvantaged” status is calculated by assessing variables such as whether the student’s parents had received a high school diploma, eligibility for subsidized meals, and participation in social service programs. However, in community colleges, students were flagged as “economically disadvantaged” if they received financial aid, participated in a different set of social service programs, or the college had identified the individual as being low income.
Although some community members expressed concern that this process would result in the data set being sharply curtailed, the agencies expanded the number of available data points that they would be included in the data system from 160 to 200. A limited number of data points were removed due to concerns about data quality, with clear public documentation as to the nature of those concerns and commitments by the state agencies to work to improve these data points so they could be included in the future. The discussions also surfaced inconsistencies in definitions, which state agencies then agreed to investigate further to determine whether they could adopt common calculations or defer to one agency as the source of truth.
California’s data points
You can review this information to see which data points were identified as being necessary to answer the research questions and how they were defined, to see if similar data might be appropriate to share in your state.

